When a random variable counts things, write it as a sum of indicators. Each indicator is one when a particular event occurs and zero otherwise. Its expected value is the event's probability.
This turns a distribution problem into a set of simpler probability questions. You often do not need every possible value of the final count.
An original category problem
Five independent observations each belong to category A, B or C with equal probability. What is the expected number of distinct categories observed?
Define I_A as one if A appears at least once, and similarly define I_B and I_C. The distinct-category count is D = I_A + I_B + I_C.
A is absent only if all five observations land in the other two categories. That probability is (2/3)^5 = 32/243. Therefore:
E[I_A] = 1 − 32/243 = 211/243.
By symmetry, each category has the same probability of appearing. Summing gives:
E[D] = 3 × 211/243 = 211/81, approximately 2.605.
The answer lies between one and three, as it must. It is near three because five chances often cover the three categories, but complete coverage is not certain.
Where independence is used
Independence of the five observations justifies multiplying the five absence probabilities. Independence of I_A, I_B and I_C is not required to add their expectations. In fact, those indicators are dependent.
Keep these two steps separate. “Linearity does not require independence” does not give permission to multiply probabilities for dependent observations earlier in the calculation.
Unequal category probabilities
If category probabilities are p_A, p_B and p_C, with independent draws and probabilities summing to one, the same argument gives:
E[D] = Σ [1 − (1 − p_j)^5].
The categories need not be equally likely. A rare category is less likely to appear, which changes its contribution to the expected count.
A different kind of count
Suppose ten devices each have failure probability 0.03. The expected number of failed devices is 0.3, even if their failures are dependent, provided those marginal probabilities are correct. Dependence does affect the variance and the chance that many fail together. An expected count alone does not describe that risk.
When you practice, write down exactly what each indicator represents. “One for each observed category” and “one for each observation” count different things.
The probability workbook develops indicators, conditional expectation and dependence with worked exercises. Continue with bounding an answer to check whether a result is plausible before trusting its arithmetic.
Read before choosing
Open the actual pages.
11 sample pages, including complete explanations. No email address or account required.
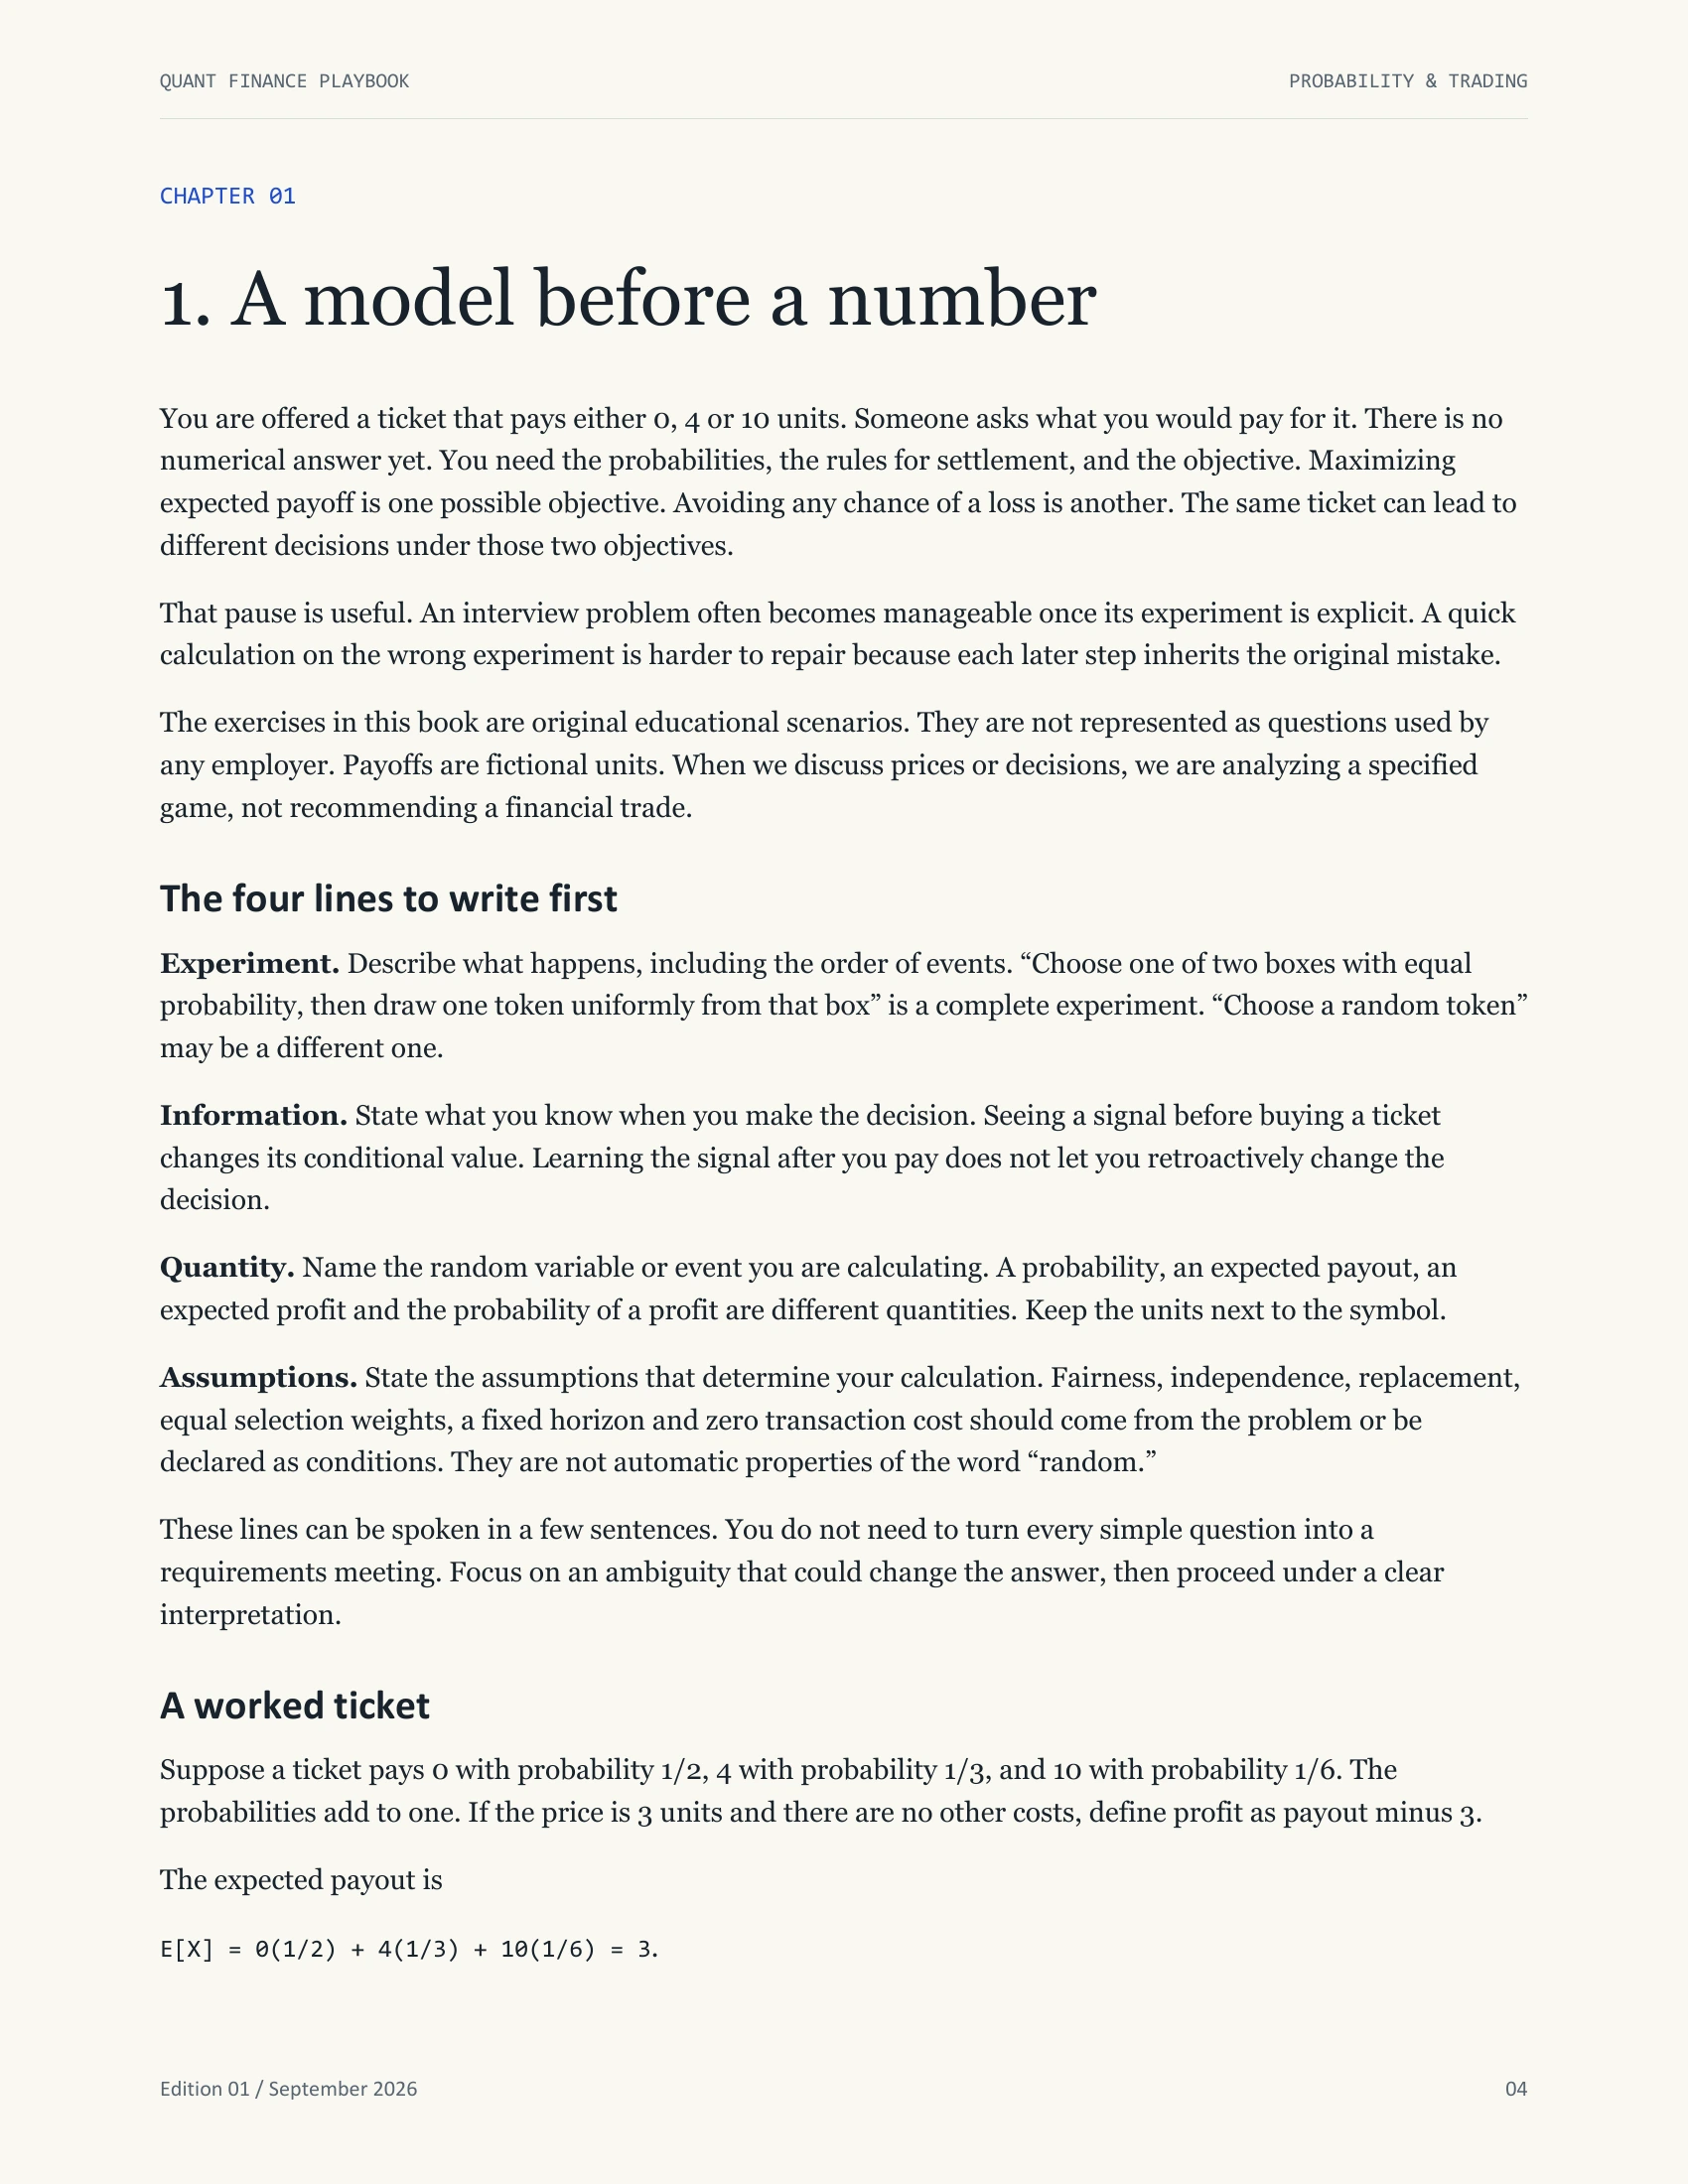
Open the PDF previewPreview page 4 of 11. Use Enlarge page for a closer view. When the page is focused, use left and right arrows to change pages.